Example 3:
How to Plot the Entropy
for a Sample
In
this example, you will take a sample generate a profile, compute the entropy
and plot it.
Convert a Multi-FASTA file
into a profile:
In
this example, we will convert a multi-FASTA into a profile.
1. Go (cd) into the ANDES/example_data directory.
2. Run Clustalw2 on sequences to generate .aln file
clustalw2
-infile=20090416.fasta -quicktree
This will generate the 20081201.dnd and the 20081201.aln file.
3. Convert .aln file to profile.
../ClustalALN_to_PositionProfile.pl
-a 20090416.aln
This will generate the 20081201.prof.
Compute the Variation for a
profile:
4. Compute the Normalized Shannon Entropy for the profile:
../Compute_NormalizedShannonEntropy_for_Profile.pl
-i 20090416.prof -o 20090416
This will generate the positional entropy file, 20090416.ent
5. Plot the entropy file:
../Plot_Entropy.r 20090416.ent
This will generate an Adobe Acrobat PDF File named 20090416.ent.pdf
6. Visualize the PDF file with your favorite viewer:
acroread 20090416.ent.pdf
The results should look something like this:
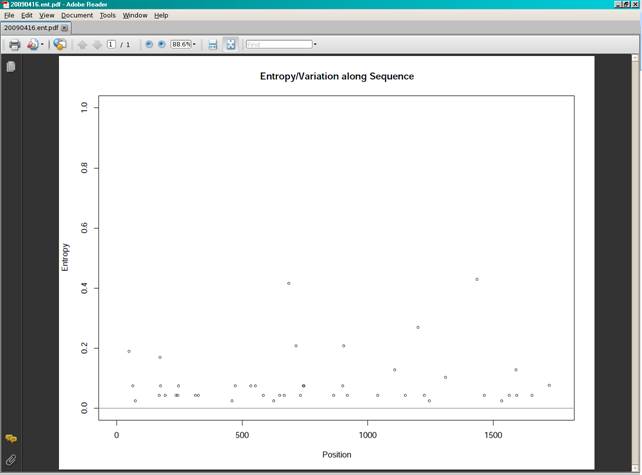
From this plot you can see that the variation is fairly random along the aligned sequences. There are a couple of peaks around 600-700 and near 1500, that may be interesting.