Example 1:
How to Generate an RMSD
Plot Between a Reference and Multiple Samples
In
this example, you will take 3 samples and compare it against a reference. You
can find some sample input files in ANDES/example_data. Remember that each fasta file contains all
the reads for a given sample, thus each profile represents the reads that are
in a sample.
Convert a Multi-FASTA file
into a profile:
In
this example, we will convert a multi-FASTA into a profile.
1. Go (cd) into the ANDES/example_data directory.
2. Run Clustalw2 on sequences to generate .aln file
clustalw2
-infile=20081201.fasta -quicktree
This will generate the 20081201.dnd and the 20081201.aln file.
3. Convert .aln file to profile.
../ClustalALN_to_PositionProfile.pl
-a 20081201.aln
This will generate the 20081201.prof. Repeat steps 2 and 3, for 20081116.fasta, and 20090501.fasta, as well.
This will leave you with 4 .prof files.
Convert a FASTA file with ambiguity codes into a
profile:
In
this example, we will convert a single record FASTA file into a profile.
1. In the ANDES/example_data directory, execute the following script:
../FASTA_to_PositionProfile.pl
-f reference.fasta -o reference.prof
This will generate the FJ966952.prof. The name of the profile is based on the id in the defline. If you want a different name, use the -o option, for this example, we will go with the default.
Compute the RMSD distance between the reference
profile and each of the sample profiles
1. In the ANDES/example_data, execute the following script:
../Compute_DiffFromRef_PositionProfile_per_position.pl
-o distFromRef -r reference.prof 20081201.prof 20090501.prof 20090416.prof
This will generate the distFromRef file.
2. To plot the distFromRef file, run the script:
../Plot_PositionProfile_From_Reference.r
distFromRef
This will generate the distFromRef.pdf file.
3. You can view this with the Linux acroread command, or whatever Acrobat reader you have installed.
You should see something like the following:
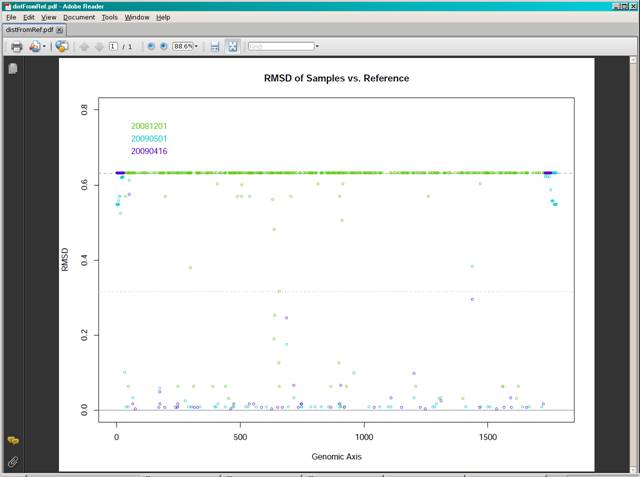
From this plot you can see that samples 20090416 and 20090501 are similar to the reference, but 20081201 has many more positions that are different. There is also a region between 500 and 1000 that seems to have more variation.